Affiliate Disclosure: This post contains affiliate links. If you purchase through my links, I may earn a small commission at no extra cost to you. I only recommend products I personally use.
Stack System Program 6 is done. My final training session was March 16, 2026. My official progress check-in — where the Stack app locks in your end speed — was March 22. Fifteen months after I swung a Stack club for the first time in December 2024.
The headline number: I started at 105 mph and finished at 106 mph. One mile per hour of driver speed gain. If you were expecting a dramatic reveal, this isn’t that article. But if you want to understand what actually happens when a 56-year-old sticks with an overspeed protocol through six programs and 15 months, this is the honest version.
Stack System Program 6: The Full Journey First
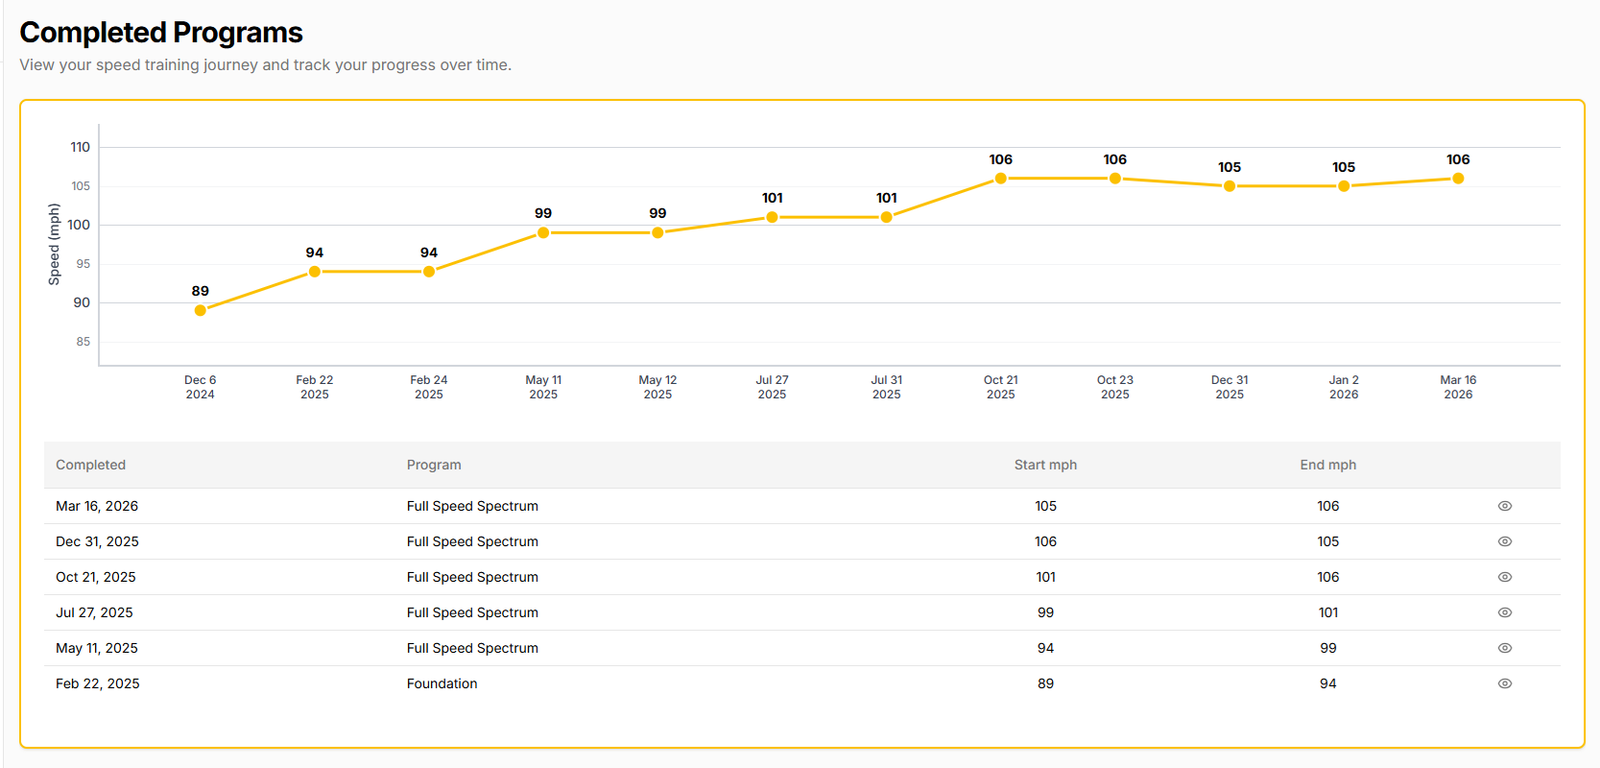
Before I break down this program specifically, it’s worth zooming out. When I started the Stack System in December 2024, my driver speed was 89 mph. I was a 7 handicap at the time. I’m a 3 now. That didn’t happen by accident.
Here’s every program checkpoint:
- Foundation (completed Feb 22, 2025): 89 → 94 mph (+5)
- Program 2 (May 11, 2025): 94 → 99 mph (+5)
- Program 3 (May 12, 2025): 99 → 99 mph (0)
- Program 4 (Jul 27, 2025): 99 → 101 mph (+2)
- Program 5 (Oct 21, 2025): 101 → 106 mph (+5)
- Program 5 recheck (Dec 31, 2025): 105 mph
- Program 6 (final session Mar 16 / progress check Mar 22, 2026): 105 → 106 mph (+1)
Total: 17 mph gained over 15 months. At 56.
For the complete breakdown of every program’s data — weights, eSpeed charts, and personal bests across the full journey — read my full Stack System swing speed results.
The gains were never linear. Program 3 produced nothing. Program 4 produced 2 mph. Program 5 was the best single program of the entire run, adding 5 mph. This one added 1. That’s how speed development actually works — you’re not going to PR every cycle, and anyone telling you otherwise is selling you something.
Every program, including this one, was assigned by the Stack algorithm. The recommended protocol all six times: Full Speed Spectrum.
Stack System Program 6 by the Numbers
The block ran from early January through March 16, 2026, with the official progress check-in on March 22. The protocol separates the final training session from the speed test — you complete the program first, then check in fresh. Here’s the full baseline vs. final breakdown across every weight:
| Weight | Baseline (Jan 2) | Final (Mar 22) | Change |
|---|---|---|---|
| Driver | 105 mph | 106 mph | +1 |
| 280g | 91 mph | 89 mph | -2 |
| 195g | 100 mph | 98 mph | -2 |
| 145g | 102 mph | 104 mph | +2 |
| 95g | 107 mph | 108 mph | +1 |
| 0g Trail | 104 mph | 110 mph | +6 |
| 0g Lead | 99 mph | 101 mph | +2 |
A few things worth noting. The heavier weights (195g, 280g) showed slight declines from baseline to final. I wouldn’t read too much into that — those numbers fluctuate based on fatigue state and how warmed up I am. The 0g Trail jump of +6 mph is the standout. That number represents unloaded swing speed, and 110 mph there is meaningful context for where my nervous system ceiling is sitting right now.
Stack System Program 6 eSpeed Breakdown
The Stack app tracks eSpeed — a projected driver speed based on your weighted training swings. Across 24 sessions, eSpeed ranged from 101 to 107 mph, ending the program at 106. That range tells the real story: my system is capable of 107 under good conditions. The final check-in landed at 106.
eSpeed is one of the more useful metrics because it’s a continuous read across every session, not a snapshot. The trendline climbed steadily through the first three weeks, plateaued briefly mid-program, then settled into a stable band of 105 to 107 mph for the final ten sessions. That stability — not the peak — is what I take as the real verdict.
Stack System Program 6 Session Volume and Grit Score
- 24 sessions completed
- 141 swings logged at the 195g benchmark weight
- Grit Score: 22 of 24 sessions at 100%, two sessions at 98–99%
- Health & Energy: 100% most sessions, dipped to 80% on sessions 8 and 23
The Grit Score is the app’s metric for session completion and max-effort compliance. 22 out of 24 at 100% means I showed up and went hard almost every single time.
The two sessions where Health & Energy dropped to 80% — that was the beginning of my plantar fasciitis. It hurt. I picked up a pair of PowerStep Pinnacle Insoles and just ground through it. I logged the honest number in the app and kept going. That’s what the Grit Score is actually measuring.
Stack System Program 6 Distance Potential
The app also calculates Distance Potential — an estimated carry based on eSpeed at a normalized temperature and altitude. The program peaked at 288 yards, ended at 285 yards (measured at 70°F, 0 ft elevation). For context, that’s the theoretical ceiling under ideal conditions. On the course, real numbers depend on strike, launch angle, spin, and what Southern California decides to do with the weather.
The Distance Potential metric is one I watch closely because it normalizes for environmental conditions — meaning this number is directly comparable to Program 5’s. The progression over the full six programs has been steady, and these final weeks held that gain rather than giving it back.
Stack System Program 6 and the @115at56 Goal
My brand goal — the one that names the site — is 115 mph driver speed before or at age 56. I turn 57 in December 2026. This was supposed to be a meaningful step toward that number.
I haven’t hit 115 with a driver. My driver best is 106 mph.
But here’s what happened that I didn’t expect: on March 6, swinging an 80g weight — one step up from the lightest training weight — I hit 115 mph. That’s the @115at56 goal weight. My nervous system has accessed that speed. The question is whether the driver catches up to the lighter weights, and how much runway I have.
The lightest weight personal bests as of the end:
- 60g: 114 mph (Feb 22)
- 65g: 113 mph (Feb 8)
- 75g: 113 mph (Feb 27)
- 80g: 115 mph (Mar 6) — the breakthrough swing
- 95g: 111 mph (Mar 2)
There’s clearly speed in there. The gap between 80g at 115 and the driver at 106 is real, and that gap doesn’t close automatically. But the pattern across this training block tells me the ceiling is higher than what’s showing up at driver weight right now.
What Stack System Program 6 Actually Proved
This wasn’t a breakthrough. It was a consolidation.
After the big jump in Program 5 — which took me from 101 to 106 mph — the next block held that speed and extended the personal best range at the lighter training weights. The driver didn’t make a dramatic leap, but the speed shelf extended upward on the light end of the spectrum.
At this stage in a long training cycle, what happened might be exactly what’s supposed to happen. The heavier weights lag the lighter ones. The driver lags the training speeds. There’s a transfer effect, but it’s not immediate and it’s not guaranteed. This program was about banking the Program 5 gains and pushing the light-weight ceiling higher.
Stack System Program 6 in the Bigger Picture
What I can say with confidence about where this sits in context: 17 mph of driver speed gain over 15 months across six programs, dropping from a 7 to a 3 handicap, consistently competing in SCGA One Day Series events, at age 56, is real. It’s documented. It’s in the app data and it’s on the scorecard.
The @115at56 goal is within reach of the training weights. Whether it translates to the driver is what Program 7 is going to answer.
Stack System Program 6 Recovery Window
Between the final session and the start of Program 7, I took a deliberate four-day rest window. No Stack training, no full driver sessions on the range. This recovery period is something I’ve learned to honor across the six programs. The nervous system needs to consolidate the gains from a block like this before the next one starts loading new stimulus.
I used the rest window to focus on mobility — specifically my pre-round yoga routine — and to log the final data into my permanent record. That post-program audit is part of what makes the next program productive.
Stack System Program 6 Lessons for Players Over 50
If you’re an older player considering the Stack System and wondering what to expect after six programs, here’s the honest read. By the time you’re this far in, your nervous system has been recruited and adapted. The big jumps from Programs 1 and 2 aren’t coming back. What I saw — small driver gain, broader speed shelf — is probably what your sixth program will also look like. That’s not a failure; that’s how the body works.
For more on this trajectory, see my swing speed for golfers over 50 breakdown, which puts these numbers in age-related context.
What’s Next After Stack System Program 6
With this program behind me, I’m moving directly into Program 7. The algorithm is recommending Full Speed Spectrum again — same protocol I’ve run all six times. I’ll document the baseline numbers when the app sets them, and I’ll continue logging every session in the Speed Log.
If you’re earlier in the Stack journey and wondering what results look like at 15 months, I hope this answers the question more honestly than the marketing does. The Stack System works. It’s not magic and the gains aren’t linear, but 17 mph over 15 months at my age speaks for itself.
Next in the Journey
Program 7 Complete: 106 → 111 mph
The next chapter is written. Program 7 added another 5 mph of driver speed and brought a new personal best of 111 mph at age 56.
Read Program 7 Complete →Frequently Asked Questions: Stack System Program 6
What results did Stack System Program 6 produce?
Stack System Program 6 added 1 mph of driver speed, moving from 105 to 106 mph at the official progress check-in on March 22, 2026. While that’s a modest driver gain, the 0g Trail weight jumped 6 mph — from 104 to 110 mph — indicating meaningful nervous system adaptation that hadn’t yet fully transferred to the heavier driver. Stack System Program 6 eSpeed ranged from 101 to 107 mph across 24 sessions, ending at 106.
How many sessions does Stack System Program 6 require?
Stack System Program 6 ran 24 sessions for me, completing on March 16, 2026, with a separate official progress check-in on March 22. The Stack System Program 6 protocol assigned was Full Speed Spectrum — the same protocol recommended across all six of my programs. Grit Score for Stack System Program 6 was 22 of 24 sessions at 100%.
Is Stack System Program 6 worth doing after slower programs?
Yes. Stack System Program 6 followed my strongest single program (Program 5, which added 5 mph) and still extended the light-weight speed ceiling — including a 115 mph breakthrough on the 80g weight on March 6. Speed development is not linear. Stack System Program 6 was a consolidation block that banked Program 5 gains and pushed personal bests at the lighter training weights, which is exactly what this stage of training should do.
What is the cumulative gain after Stack System Program 6?
After Stack System Program 6, my total gain across all six programs was 17 mph — from 89 mph at the start of the Foundation program in December 2024 to 106 mph at the Stack System Program 6 check-in in March 2026. That’s 15 months of consistent training at age 56, dropping from a 7 to a 3 handicap in the process.
Does the Stack System work for golfers over 50?
Stack System Program 6 — and the five programs before it — produced 17 mph of verified driver speed gain for a 56-year-old golfer over 15 months. The neural adaptation mechanism behind the Stack System doesn’t stop working after 50. The gains per program get smaller as your baseline rises, but the compounding effect across multiple programs is real and documented in my data. Use my Stack System discount link for 10% off if you’re ready to start your own program.
How does Stack System Program 6 compare to earlier programs?
Stack System Program 6 produced the smallest driver gain of any program in my journey — just 1 mph versus gains of 5, 5, 0, 2, and 5 mph in prior programs. But that framing misses the point. Stack System Program 6 came after the biggest single-program gain of the entire run. Consolidation programs are part of the process. The light-weight personal bests in Stack System Program 6 — including 115 mph on the 80g weight — show the ceiling is still rising even when the driver number isn’t moving dramatically.
Training data sourced from the Stack System app, Full Speed Spectrum protocol. All speed measurements via the Stack radar. Distance Potential calculated at 70°F, 0 ft elevation. Final training session: March 16, 2026. Official progress check-in: March 22, 2026.