Affiliate Disclosure: This post contains affiliate links. If you make a purchase through these links, I may earn a commission at no extra cost to you. I only recommend products I personally use and trust.
Most golf club distance chart articles online are guesses. Mine isn’t — it comes from Arccos sensors tracking the last 100 shots of every club in my bag, at a 106 mph driver swing speed, as a 56-year-old 3-handicap SCGA competitor. The numbers below are real, and the patterns inside them revealed something about my game I didn’t expect to find.
My Complete Golf Club Distance Chart at 106 MPH
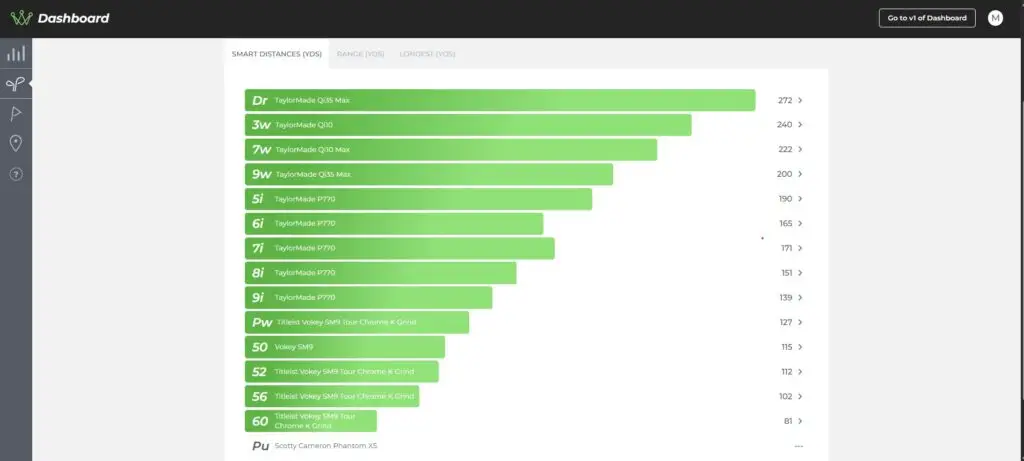
Here’s every club in my bag with the average carry distance, the typical range, and the longest tracked shot. All data is Arccos-measured from real rounds on real courses — not range numbers, not launch monitor data, and not estimates.
| Club | Model | Smart Distance | Range | Longest |
|---|---|---|---|---|
| Driver | TaylorMade Qi35 Max | 272 | 267-279 | 324 |
| 3 Wood | TaylorMade Qi10 | 240 | 229-234 | 236 |
| 7 Wood | TaylorMade Qi10 Max | 222 | 219-227 | 245 |
| 9 Wood | TaylorMade Qi35 Max | 200 | 188-199 | 205 |
| 5 Iron | TaylorMade P770 | 190 | 187-203 | 242 |
| 6 Iron | TaylorMade P770 | 165 | 164-181 | 200 |
| 7 Iron | TaylorMade P770 | 171 | 163-168 | 175 |
| 8 Iron | TaylorMade P770 | 151 | 148-155 | 170 |
| 9 Iron | TaylorMade P770 | 139 | 136-144 | 164 |
| PW (46°) | Vokey SM9 | 127 | 124-128 | 140 |
| GW (50°) | Vokey SM9 | 115 | 110-116 | 128 |
| GW (52°) | Vokey SM9 | 112 | 108-111 | 117 |
| SW (56°) | Vokey SM9 | 102 | 99-103 | 115 |
| LW (60°) | Vokey SM9 | 81 | 78-82 | 95 |
All numbers in my golf club distance chart are carry yardage measured in yards. Smart Distance is the Arccos algorithm’s recommended yardage for course play (accounting for typical mishits). Range shows where the bulk of my shots land. Longest is my single longest tracked shot with that club.
How I Built This Golf Club Distance Chart Using Arccos
Every shot in this golf club distance chart was tracked by Arccos Smart Sensors Gen 4 during real rounds — practice rounds, tournament rounds, and casual rounds combined. The Arccos system records carry distance using GPS coordinates and accelerometer data on every full swing.
Each club’s data here represents the last 100 shots tracked, which is a large enough sample size to filter out random noise. The driver row uses the last 90 days only since I’ve been gaining swing speed and older numbers understate my current carry. Every other club uses full Arccos history because my iron and wedge distances have stayed consistent for a while.
A few methodology notes that matter for accuracy. Arccos sometimes shows a “Smart Distance” that’s slightly different from the Range midpoint because the algorithm weights toward typical playing conditions. For most clubs in my golf club distance chart, the Smart Distance and Range agree closely. For two clubs — my 3 wood and 5 iron — they don’t. I’ll explain why below.
The 6 Iron Mystery Inside My Golf Club Distance Chart
Here’s the first thing that jumped out when I built the golf club distance chart. My 7 iron goes 171 yards. My 6 iron goes 165 yards. That’s a 6-yard gap in the wrong direction — the longer club is shorter.
My first instinct was to blame sample size. But the dispersion data killed that theory. Both clubs hit greens at 60% — the same rate. Both clubs leave me an average of 18 yards to the pin when I miss. The patterns are nearly identical except for one striking difference: my 6 iron misses short 30% of the time. My 7 iron only misses short 10% of the time.
That’s a deceleration pattern. When I pull the 6 iron on the course, I think about the 165-180 yard zone and I steer the shot. I don’t make my full, committed swing. The 7 iron lives in a yardage range where I trust myself to rip it — 160-180 yards is my comfort zone, and I make a full pass at it. The data doesn’t lie. The 6 iron has become a guidance club for me, and that’s why a club designed to go farther actually goes shorter in real rounds.
If you’re noticing weird gaps in your own bag, the dispersion view in Arccos is where the truth lives. Average distance alone won’t tell you anything. Average distance plus dispersion plus miss patterns will tell you exactly which clubs you trust and which clubs you’re protecting.
The Hidden Pattern in My Golf Club Distance Chart: 5 Clubs Miss Short
When I pulled all 14 dispersion charts together for my golf club distance chart analysis, a systemic pattern showed up that I didn’t expect. Five clubs in my bag miss short of the green 24% or more of the time:
- 3 Wood — 100% miss short
- 9 Wood — 100% miss short
- 5 Iron — 50% miss short
- 52° Wedge — 31% miss short
- 50° Wedge — 35% miss short
This pattern explains something I’ve been struggling to understand. In my recent Desert Springs SCGA tournament recap, my Arccos strokes gained data showed -2.0 in short game while my approach play looked roughly average. I’d been treating short game as the weak link. But the dispersion data tells a different story. My short game is having to work overtime because my approach shots leave me in the wrong spots — short of the green, with chips and pitches needing to land perfectly to save par.
A 3 wood that misses short 100% of the time isn’t a 3 wood problem — it’s me under-clubbing on par 5 approach shots because I don’t trust the carry. A 50° wedge missing short 35% of the time isn’t a wedge problem — it’s me playing safe on full wedge shots to avoid the long miss. The pattern across five clubs makes it unmistakable: I’m a chronic under-clubber on approach. That’s a course management adjustment, not a swing fix.
My Most Accurate Club in This Golf Club Distance Chart Wasn’t What I Expected
When I sorted every approach club in my golf club distance chart by green-hit percentage, the winner surprised me. It wasn’t a wedge. It wasn’t a short iron. It was my pitching wedge — 75% greens hit, 0% missed short, 0% missed long, 13% missed left, 13% missed right.
My 60° lob wedge tied at 75% greens. My 56° sand wedge sits at 69%. My 9 iron is at 70%. Those numbers make sense to me intuitively — short clubs should be accurate. But the pitching wedge being the most reliable club in my bag at 127 yards out tells me something specific: when I have a stock yardage that matches a club exactly, I deliver. The trouble starts when the yardage falls between clubs, which is exactly when I start steering and the dispersion gets ugly.
This is why distance gapping matters more than peak distance. A bag full of clubs that each cover an exact 12-15 yard window will beat a bag full of “longer” clubs every time. Looking at my golf club distance chart, my gapping is clean from 9 iron down to lob wedge. It gets messy in the mid irons. That’s where the work is.
How My Golf Club Distance Chart Compares to the Average Golfer
For context, the average golf swing speed by age for a 56-year-old is roughly 89-92 mph driver, which translates to a driver carry of about 215-225 yards. My 272-yard driver carry on this golf club distance chart sits well above that band — the result of 15 months of Stack System overspeed training that took me from 89 mph to 106 mph.
The gain shows up in every club, not just driver. My 9 iron at 139 yards is closer to a tour pro’s 9 iron number than a typical amateur’s. My 7 iron at 171 yards is in the same range as scratch amateurs and mini-tour players. None of this is bragging — it’s data. The speed work is real, and the iron distances are the proof.
For context on what speed training actually delivers, my honest Stack System review covers the 6-program journey, and the Stack System with my 10% discount is what I’m still using to chase 115 mph at 56.
The Tournament Bag Swap on My Golf Club Distance Chart
If you’re sharp, you noticed two gap wedges in my golf club distance chart — a 50° and a 52°. Both Vokey SM9. I carry both at home for practice rounds because they cover slightly different yardage windows. The 50° goes 115 yards, the 52° goes 112 yards.
In tournaments I pull the 52° out of the bag. USGA rules limit me to 14 clubs, so something has to go. The 50° wins because the 3-yard difference between the two wedges isn’t meaningful in competition — and the 50° lands greens at 53% vs the 52° at 54%, which is statistically a wash. Carrying one wedge in that range and leaning on feel for the other yardages is cleaner than trying to dial in two clubs that overlap.
This is the kind of bag decision most amateurs never think through. If you have two clubs that go nearly the same distance and produce nearly the same results, one of them is dead weight. Pull it out and add something useful — a hybrid you don’t currently carry, a different fairway wood, whatever fills an actual yardage gap.
Why My 3 Wood Looks Wrong in This Golf Club Distance Chart
The 3 wood row in my golf club distance chart is the one anomaly in the data, and I want to be honest about it. Smart Distance shows 240 yards, but the Range only goes 229-234. The longest tracked shot is 236. Those numbers don’t agree with each other the way every other club’s numbers do.
The explanation is simple: I rarely hit my 3 wood. Off the tee I almost always pull driver because I trust the carry and the dispersion. On par 5s I usually have 7 wood or longer for second shots since 3 wood off the deck is one of the hardest shots in golf. So my 3 wood sample size is much smaller than every other club, and the Arccos algorithm has less data to work with.
If I had to estimate real-world 3 wood carry based on feel and the limited data, I’d put it in the 235-250 yard range. I haven’t made enough committed full swings with this club since installing the Arccos sensors for the numbers to settle. It’s a club I’d consider replacing — maybe with a driving iron or a different fairway wood that fits my game better. For now it stays in the bag as insurance for tight tee shots where driver is too risky.
What This Golf Club Distance Chart Means for Your Game
If you take one thing from my golf club distance chart, take this: average distance is the least interesting number in your bag. The interesting numbers are dispersion, miss patterns, and the gap between what a club is supposed to do and what it actually does in your hands.
I built this golf club distance chart expecting to write a reference table. What I ended up finding was a deceleration problem in my 6 iron, a chronic under-clubbing pattern across five clubs that was masquerading as a short game weakness, and confirmation that my pitching wedge is the most trustworthy club in my bag. None of that shows up on a distance chart alone. All of it shows up when you layer dispersion data on top.
If you don’t track your shots, you’re guessing at your distances and guessing at your weak spots. Arccos sensors clip into the grip of every club and track every full swing automatically. The dispersion view alone is worth the cost of admission — average distance plus where the misses go is a complete picture of your game. I’ve been running mine for the season, and as you can see, the patterns it reveals are far more useful than any generic distance chart you’ll find online.
Pull your own data. Look at the dispersion. Find your decel club and your under-clubbing pattern. The shot you make tomorrow gets better when you know the truth about the shots you made yesterday.
Frequently Asked Questions: Golf Club Distance Chart
What is a realistic golf club distance chart for a golfer over 50?
A realistic golf club distance chart for a male golfer over 50 with average swing speed (87–92 mph) would show driver carry around 210–225 yards, 7-iron around 140–155 yards, and pitching wedge around 105–115 yards. My golf club distance chart at 111 mph shows driver carry of 272 yards, 7-iron at 171 yards, and PW at 127 yards — well above average for my age group because of 17 months of Stack System overspeed training that took me from 89 to 111 mph at 56.
How do I build my own golf club distance chart?
The most accurate way to build a personal golf club distance chart is with Arccos Smart Sensors tracking real on-course shots. Range sessions overstate carry because you’re hitting off perfect mats, fresh lies, and without course management pressure. My golf club distance chart is built from the last 100 Arccos-tracked shots per club during real rounds — practice, tournament, and casual combined. That sample size filters out noise and gives you numbers you can actually trust on the course.
Why does my golf club distance chart show inconsistent gaps between clubs?
Inconsistent gaps in a golf club distance chart almost always point to either a deceleration pattern (swinging easier with certain clubs) or a confidence issue with specific yardages. My golf club distance chart revealed a 6-iron that goes shorter than my 7-iron — classic deceleration. When I pulled dispersion data on top of average distance, the miss patterns confirmed it immediately: the 6-iron missed short 30% of the time versus 10% for the 7-iron. Average distance alone won’t catch this — you need the dispersion layer.
How does swing speed affect a golf club distance chart?
Every 1 mph of swing speed produces roughly 2–2.5 yards of additional carry. My golf club distance chart at 111 mph shows numbers that are 40–55 yards longer per club than when I was at 89 mph — which matches that formula across the bag. The gains show up everywhere, not just the driver. My 9-iron at 139 yards is closer to a scratch amateur’s number than a typical 56-year-old’s. Speed training lifts every club in the golf club distance chart, not just the driver.
Should I use range distances or on-course distances for my golf club distance chart?
Always use on-course distances for your golf club distance chart. Range distances are typically 10–20% longer than real carry because you’re hitting off perfect conditions with no stakes. My golf club distance chart uses Arccos-tracked carry from real rounds only — that’s the number that matters when you’re standing 165 yards out on hole 14 of an SCGA tournament. Range numbers are useful for working on mechanics; on-course numbers are what you actually club yourself with.
What is the most important insight from a golf club distance chart?
Average distance is the least interesting number in your golf club distance chart. The most important insights come from miss patterns and dispersion — where the misses go, not just how far the center goes. My golf club distance chart revealed a systemic short-miss pattern across five clubs that I’d been misidentifying as a short game weakness. Once I saw the dispersion data, I realized the problem was under-clubbing on approach, not poor chipping. A golf club distance chart with dispersion data is a completely different diagnostic tool than a distance chart alone.